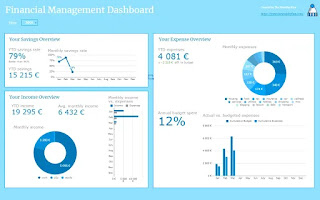
All you need for budgeting, tracking your expenses and calculating your savings rate is here, for free. It's created in a convenient Google Sheet format, so you do not need Microsoft Excel to use it. It's enough that you have a Google account.
Instructions
1. Make a copy of the budget and expenses tracking sheet
To get started, ensure you're signed into Google Drive and open the free budget and expenses tracking sheet. From there you need to clone it for yourself for it to work. Open the first menu item "File" and pick "Make a copy". Accepting the following dialog will make a copy of the expenses tracking sheet to your own Google Drive.
Once that's done, you will have all editing rights to the sheet.
2. Create a budget
Don't worry about getting it right the first time. Just create your first version of a budget. You can add or remove categories on the column B in the Budget Grid Input tab. Only the yellow cells should be input. The white cells are for showing actuals once you have them.
When you are done with your budget, make sure you have the correct year selected and press the blue Save budget -button. This stores the values you've input in the grid for other sheets to use. If you don't save them, they won't work.
Google Sheets will ask you permission to run scripts.
What the Load budget and actuals -button does is, it loads the budget for the selected year, but also actuals. So, if you have actuals already in the sheet for any year, you can load them into the grid to have a starting point as you make your budget. That's really handy.
I promise you, you will not find a more convenient, more usable way to iterate on your budget than this!
3. Track income and expenses
In order for the budget and expenses tracking sheet to be able to do its job, you need to give it some actual data. This is done in the Expense input and Income input tabs. Use the appropriate columns and add the Date, Amount, Category and Subcategory to their right place.
For expenses, it's good to also input your payment method in column F, so it will be easier to update the data later on.
Voilà! That's it. You'll be 100% on top of your expenses. Here are some tips to reading the outputs.
Using the budget and expenses tracking google sheet
Savings rate
This is the most important part of the expenses tracking sheet and that is why it's at the very first position of the Overview Dashboard. Since I have a lot of data from my readers using the Financial Independence Calculator, I also know what kind of savings rate people typically have. Only using this expenses tracking Google Sheet, you're able to see how you compare to others. For example, a 50% savings rate puts you in the top 30%. That's a good place to be.
Expenses breakdown
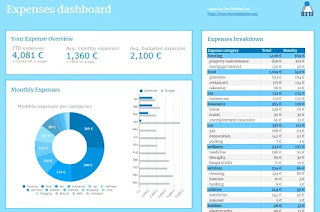
Be sure to pay attention to how your expenses develop compared to your budget. On the main Overview Dasboard you'll see these over the months, but to get a better idea, have a look at the Expenses Dashboard. This one gives you more insight into where your money goes by category, but also subcategory.
If you spot something that's off, you can go and have a look at the detailed Cashflow tab, that splits all income and expenses, per month, category and subcategory.
I'd love to hear your comments!
If you have ideas on how to improve the sheet, let me know on Twitter @thewealthyfinn


No comments:
Post a Comment